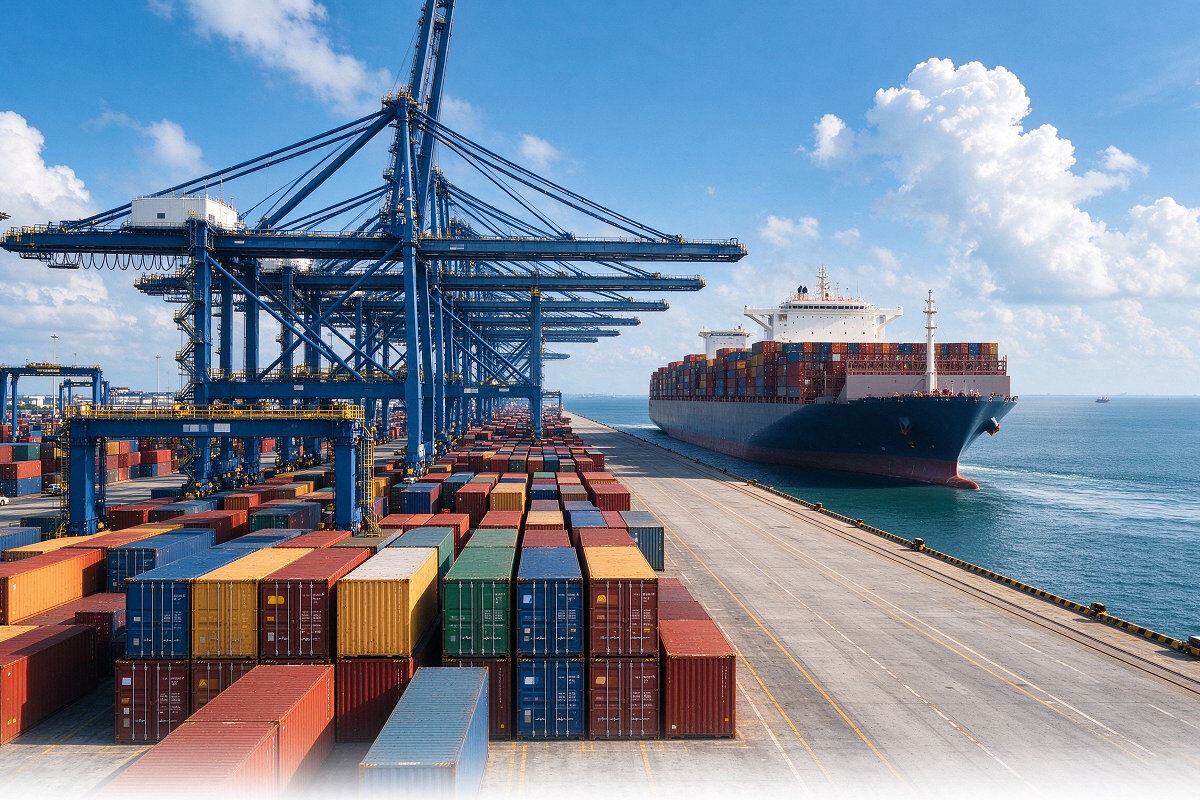
In 2026, China’s exports are characterized by “steady volume, improving quality, shifting markets, and elevated freight rates.” Exports rose 16.4% year-on-year in the first three quarters, with third-quarter exports alone surpassing 8 trillion yuan for the first time. Growth drivers have shifted from labor-intensive goods to electromechanical products, new-energy goods, and computing-power-related products. Export destinations are diversifying faster toward Belt and Road partner countries, ASEAN, the Middle East, and Latin America. However, ocean freight rates have surged across all routes since the second quarter, placing significant pressure on low-margin categories.
Leading Export Industries: Electromechanical Products Dominate; the “New Three” Continue to Expand
The structural highlights of current exports are concentrated in technology-intensive and green, low-carbon sectors.
- Electromechanical products are the undisputed mainstay: Electromechanical exports grew 23.7% in the first three quarters, well above the overall growth rate. In the first quarter, electromechanical products accounted for 63.4% of total export value, up 3.5 percentage points year-on-year. The equipment manufacturing sector contributed nearly 90% of export growth.
- The “new three” maintain high growth: In the first half, combined exports of electric vehicles, lithium batteries, and photovoltaic cells reached 819.664 billion yuan, up 46.1% year-on-year. In June alone, exports of electric passenger vehicles broke the 70 billion yuan mark for the first time, with monthly export volume reaching 589,200 units, up 109% year-on-year. Among green products in the first quarter, electric vehicles, lithium batteries, and wind turbines and parts grew 77.5%, 50.4%, and 45.2%, respectively.
- Ships and chips stand out: From January to May, new shipbuilding orders accounted for 81.2% of the global total, with some shipyards booked through 2030. Integrated circuits are also grouped among the “four major export items,” alongside ships, new energy vehicles, and photovoltaics, as representatives of manufacturing upgrading.
Export Value: 23.2 Trillion Yuan in the First Three Quarters, with Growth Accelerating Quarter by Quarter
In RMB terms, total exports reached 23.2 trillion yuan in the first three quarters, up 16.4% year-on-year. The pace accelerated from 11.9% in the first quarter to 22% in the third quarter. On a monthly basis, exports in September totaled 3.03 trillion yuan, up 29.6% year-on-year, marking the sixth consecutive month of double-digit growth. First-half data were similarly solid, with exports of 9.33 trillion yuan in the first four months, up 11.3% year-on-year.
Destination Countries: ASEAN Remains No. 1; US Share Continues to Decline
The structure of export markets is undergoing a systematic shift. In the first three quarters, trade with ASEAN reached 6.84 trillion yuan, up 22.7%, keeping ASEAN as China’s largest trading partner. Trade with the EU grew 8.4%, and trade with the US grew 4.1%, though the US share of China’s exports continues to decline. Customs data for the first four months show exports to the US falling 12.7% year-on-year, while exports to ASEAN rose 15.7% and to the EU rose 15.6%. Africa has emerged as one of the fastest-growing destinations, with exports to Africa surging 49.9% in January–February.
The core logic behind this shift: infrastructure investment and industrialization demand in emerging markets are partially offsetting trade barrier pressure from developed markets.
Ocean Freight Rates: Across-the-Board Surge from Q2, Cost Pressure Mounts
The 2026 shipping market has followed a markedly different rhythm from previous years, with rate increases arriving earlier and more sharply. Data from the Shanghai Shipping Exchange show that in early June, 40-foot container rates from Shanghai to the US West Coast and East Coast stood at $4,149 and $5,333, respectively, up 31.5% and 23.6% from earlier levels. Year-to-date, US West Coast rates have risen 87% and US East Coast rates more than 70%. Europe routes held steady above $4,100/FEU over the same period, a significant increase from $2,850 at the end of May.
The increase is not localized. Rates on Middle East, Red Sea, South America, and Africa routes have all risen in tandem. Container slots have sold out, and some goods previously shipped in containers (such as cat litter) have begun switching to breakbulk vessels to cut costs. The drivers are multiple: European and US traders restocking ahead of schedule, some firms “rushing exports” to avoid tariff risks, shipping lines proactively tightening capacity, and disruptions to Strait of Hormuz transit driving marine fuel costs up nearly 70%.
By early July, the Shanghai Containerized Freight Index had risen for ten consecutive weeks, up 77.4% from its April low. For small and medium-sized exporters, whose per-container profit may be only around $200, a rate increase of more than $1,000 can push a thin-margin order into loss, and some low-margin small-commodity orders have been postponed due to freight costs exceeding order value.
Overall, the source of China’s export competitiveness in 2026 is shifting from price advantages toward technology intensity and supply chain efficiency. Diversified market positioning has effectively cushioned the impact of demand fluctuations in any single economy. However, elevated and volatile ocean freight costs are becoming a real bottleneck constraining profit recovery for small and medium-sized foreign trade enterprises.